The Texas eBird “Last 10 Years” Project
In early 2024, I got hit with a nagging curiosity: How many bird species are actually seen in Texas every single year?
Texas is massive, and while our state list is legendary, I wanted to know what constitutes the “reliable” core of our avifauna—the species that show up year after year without fail. Using eBird’s massive database, I decided to find out.
The Method to the Madness
I started with a 10-year window (2014–2023), assuming 2014 was the “sweet spot” where eBird usage became widespread enough to be truly representative.
My secret weapon? The eBird Bar Charts. I’ve always used them to see what’s in the area, but I eventually learned how to use the “Download Histograms” link at the bottom of the page. I imported those files into spreadsheets and started the “cleaning” process—filtering out the “spuhs,” hybrids, and exotics not yet recognized by the Texas Bird Records Committee (TBRC). (I’m still waiting for that Egyptian Goose to make the official cut!)
Initially, I found 616 species seen over that decade. But that wasn’t the real answer. I wanted to know the streaks.
The Results
After sifting through year-by-year data, I discovered that 492 species were seen in Texas every single year for ten years straight. It’s been fascinating to watch the trends; while checklist volume has exploded, the number of species isn’t always a linear climb.
I even found myself “sweat-watching” the 2024 data in July—waiting for a Lewis’s Woodpecker to be reported just to keep the 10-year streak alive!
Explore the Data
What started as a curiosity turned into a bit of an obsession. I’ve since written scripts to automate this for every single county in Texas. Whether you want to see the state-wide trends or dive into your local patch, you can explore the live sheets and previews below:
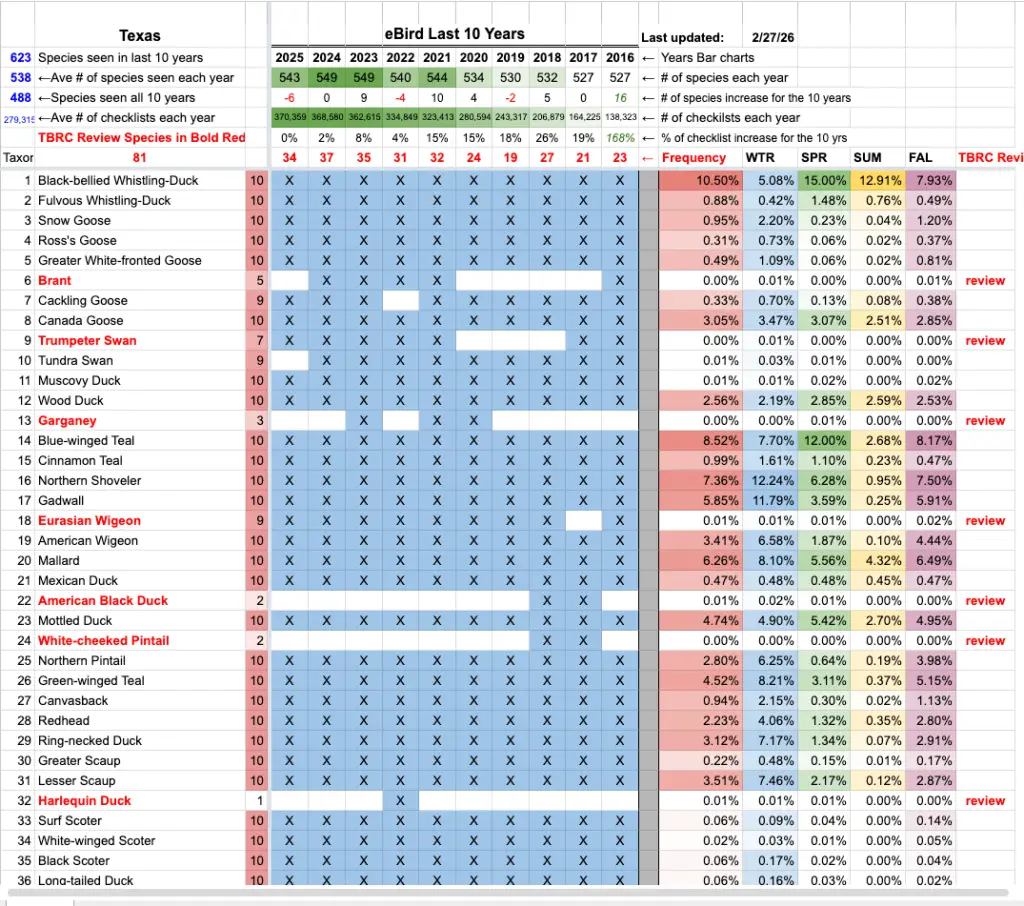
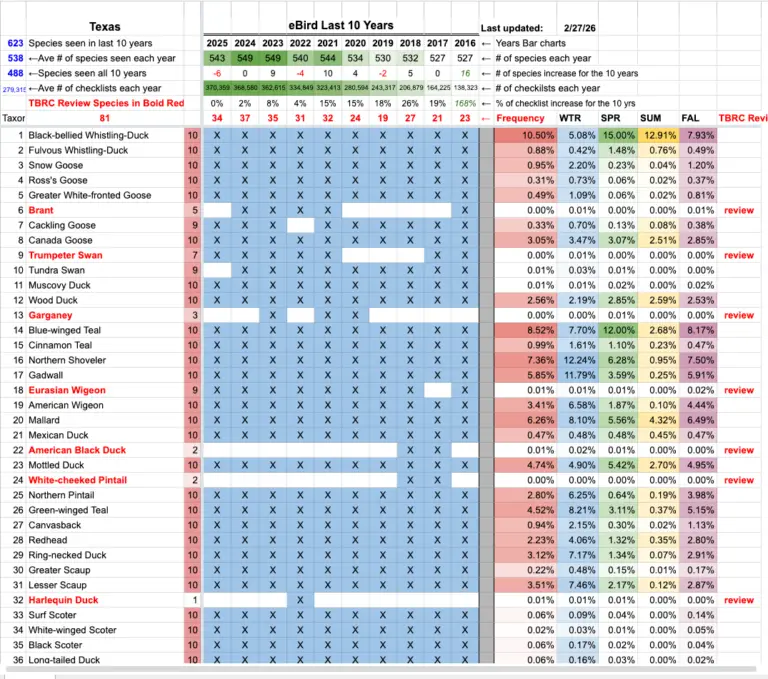
Texas Last 10 Years – Master State Sheet: The full breakdown of the latest sheet with what is now 488 consistent species.
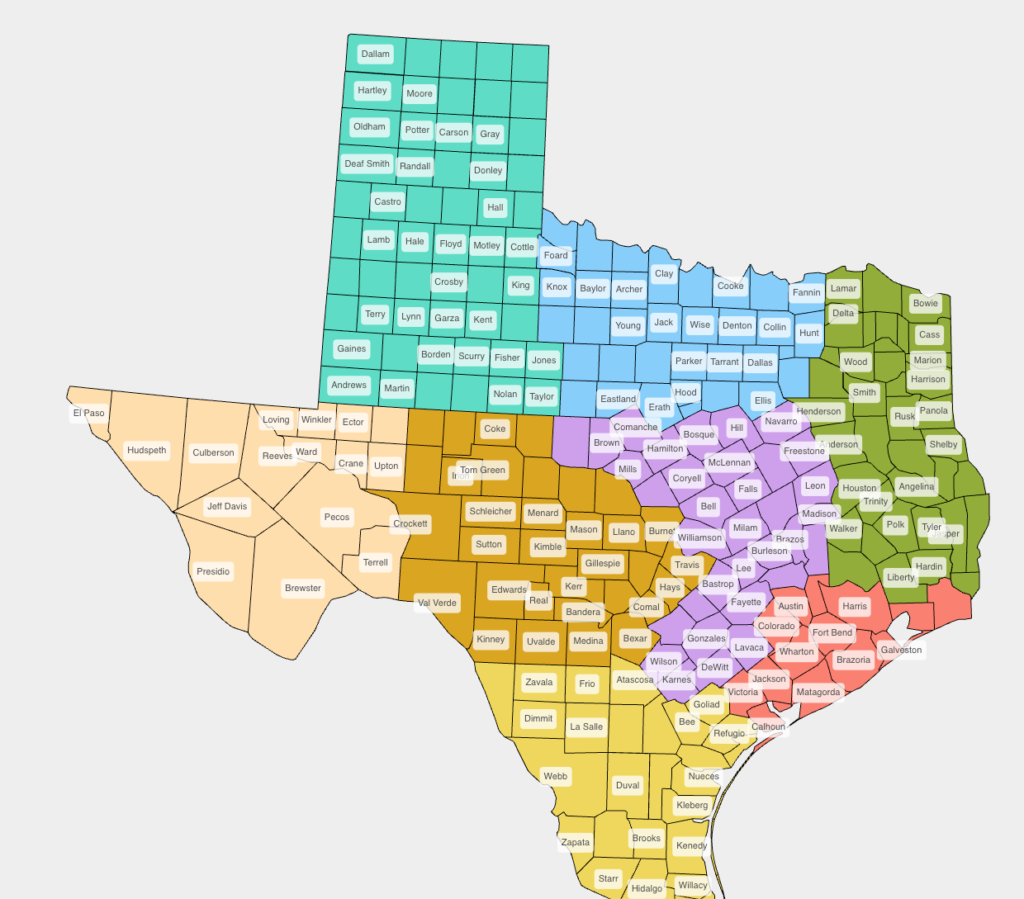
Last 10 Years by County: An interactive map linking you to individual county data.
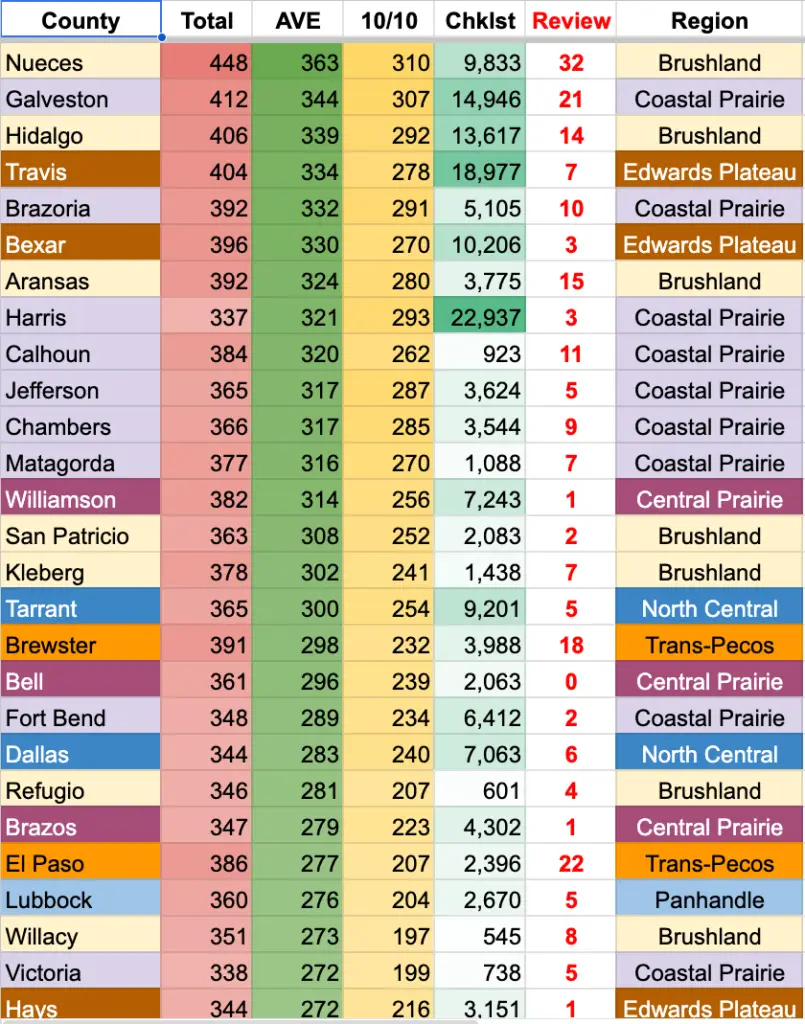
Texas County Comparison Totals: See how your home county stacks up against the rest of the state.